
|
|
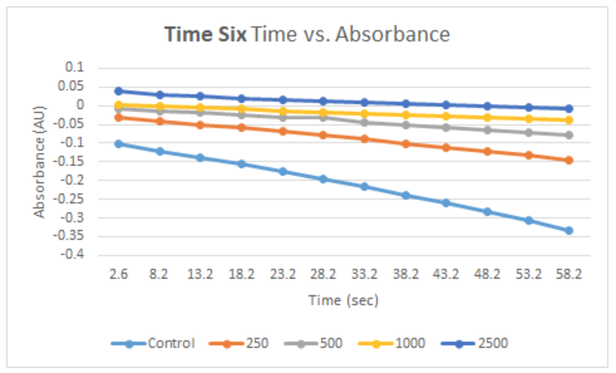
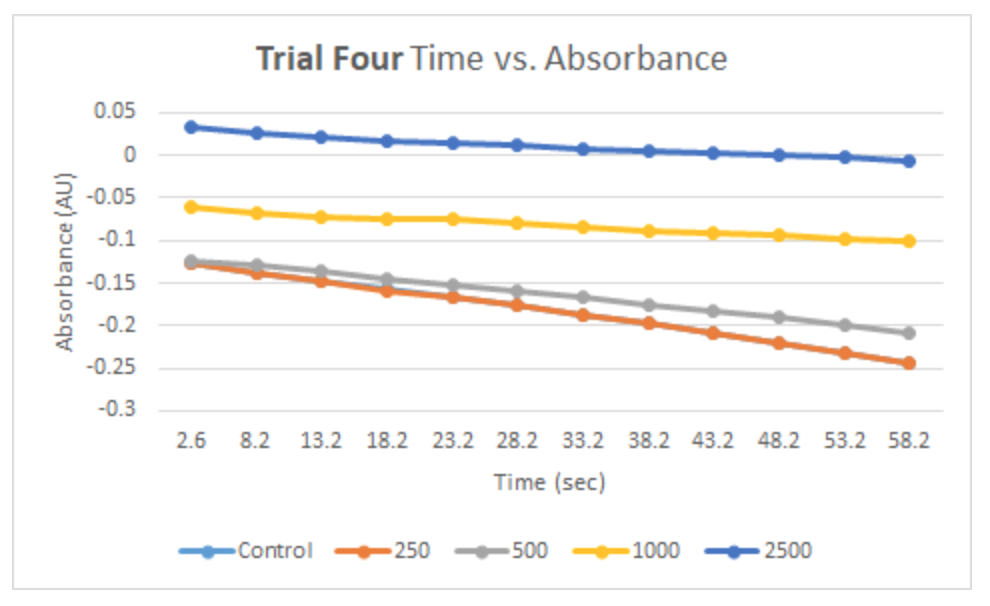
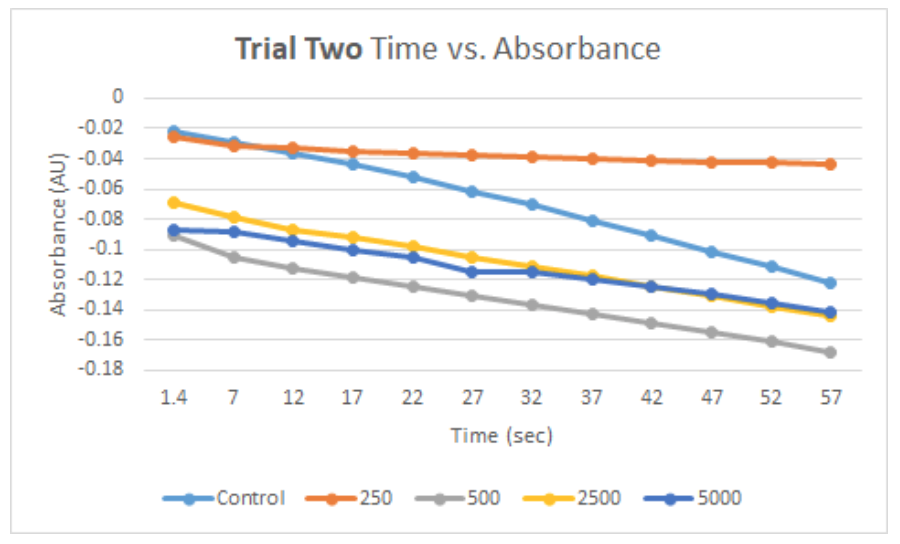
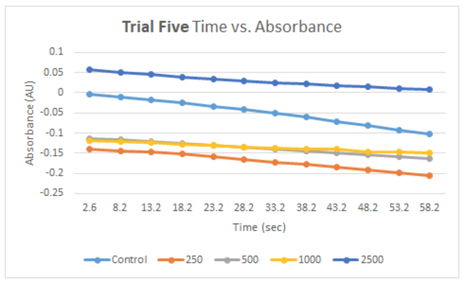
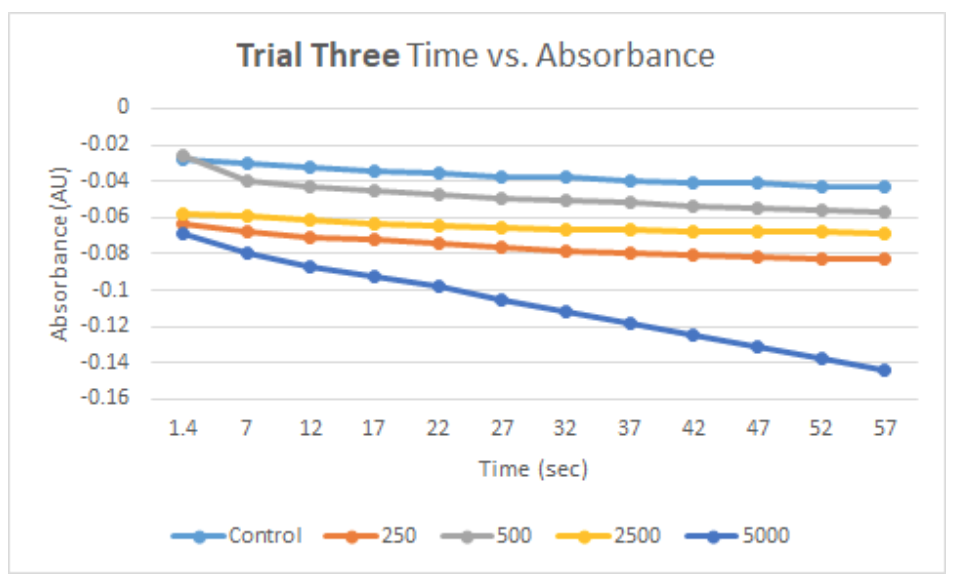
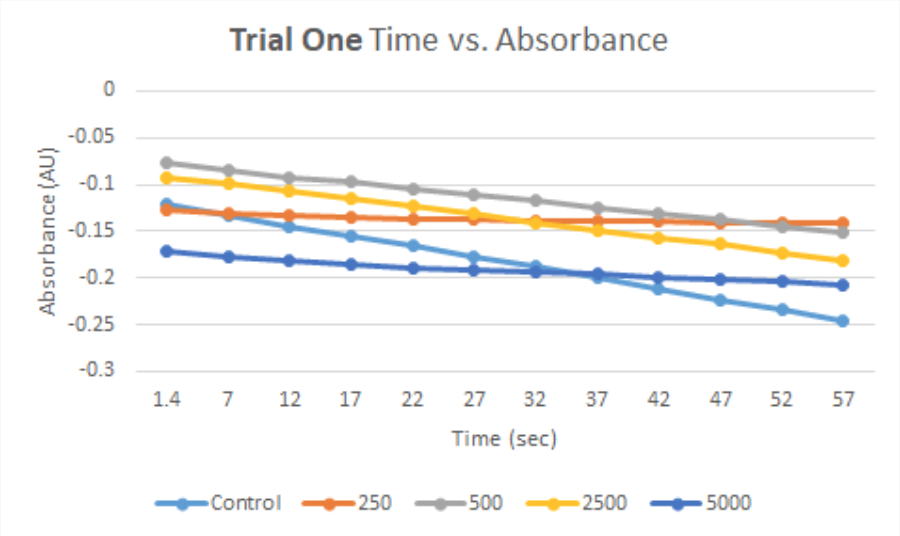
Figure 8: Graphical Representation of Time vs. Absorbance seen from diode array, regarding NADH concentrations. The greater the incline the slower the reaction was going, and the greater the decline the faster the reaction was going.
From the diode array, some interesting results were seen...
It was seen through an ANOVA that a significance difference between the treated and the control group in the data set was found. A duncan waller post hoc test showed that the difference lied between 1000, 2500, and 5000 micro molar concentrations of metformin.
1000 and 2500 micro molar solutions looked fine, however, it was seen that the average 5000 micro molar concentration was at a greater decline than the control group. This could have been error, or because 5000 micro molar is way outside pharmokinetic concentrations.
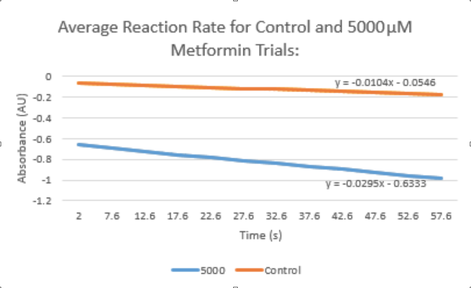
Figure 9: Comparison between the two rates of reaction (500 micro molar and control)
Despite this, there was inhibition of pyruvate carboxylase, supporting the hypothesis that metformin inhibits pyruvate carboxylase, leading to the inhibition of gluconeogenesis.
